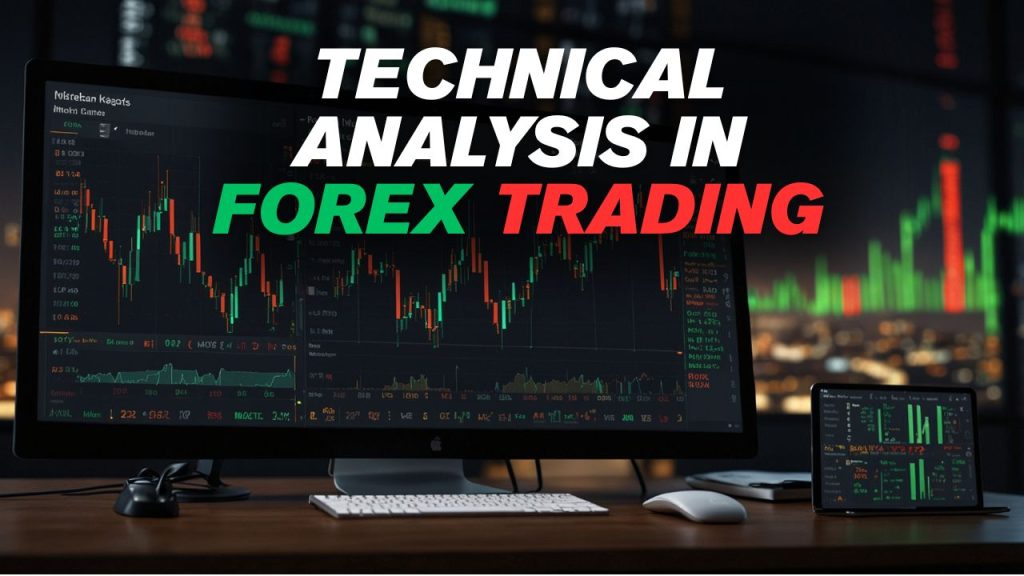
Forex trading mein technical analysis ka matlab hai charts, price movements, aur indicators ka use karke future market direction ko predict karna.
Aasan lafzon mein, yeh ek toolbox hoti hai jahan aap past price action ka study karke decide karte hain ke market ab upar jayega ya niche.
Yeh approach un logon ke liye perfect hai jo numbers, patterns aur data analysis mein interest rakhte hain — aur bina news ke market ko samajhna chahte hain.
🧠 Why Technical Analysis is Important in Forex?
Forex market har waqt move kar raha hota hai — lekin har move random nahi hota.
Technical analysis aapko help karta hai:
- ✅ Identify karne mein ke market ab bullish (upar) ya bearish (niche) hai
- ✅ Stop loss aur take profit sahi jagah lagane mein
- ✅ Trend follow karne aur market entry exit timing theek karne mein
🔧 Common Tools Used in Technical Analysis
Yeh kuch top tools aur indicators hain jo har forex trader ko seekhne chahiye:
| Tool / Indicator | Purpose |
|---|---|
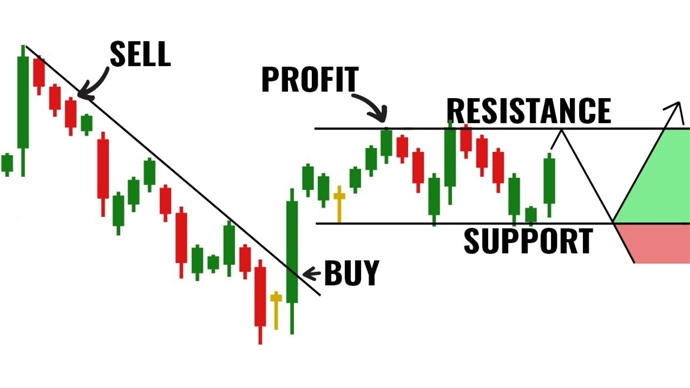
| Support & Resistance | Identify karo kaha se price bounce karega |
| Moving Averages (MA) | Trend direction check karne ke liye |
| RSI (Relative Strength Index) | Overbought ya oversold zones dikhata hai |
| MACD | Trend reversal aur momentum measure karta hai |
| Candlestick Patterns | Market psychology samajhne ke liye |
| Trendlines & Channels | Price ka structure aur range dikhata hai |
Check Also: Forex Trading Full Course in Urdu PDF [2025] – Free Download
🔧 Simple Tools You Should Know
- Candlestick Charts – Show price movement clearly
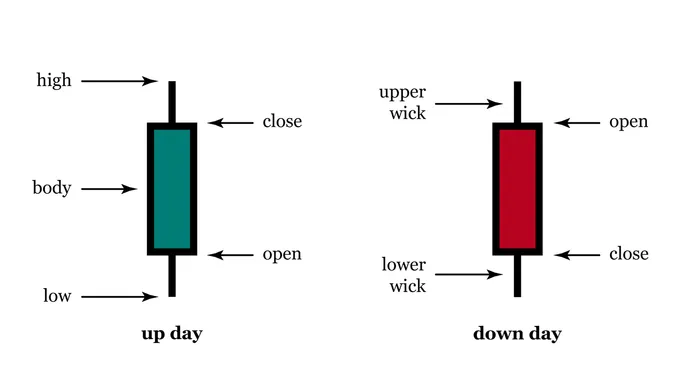
2. Support & Resistance – Key price levels to watch
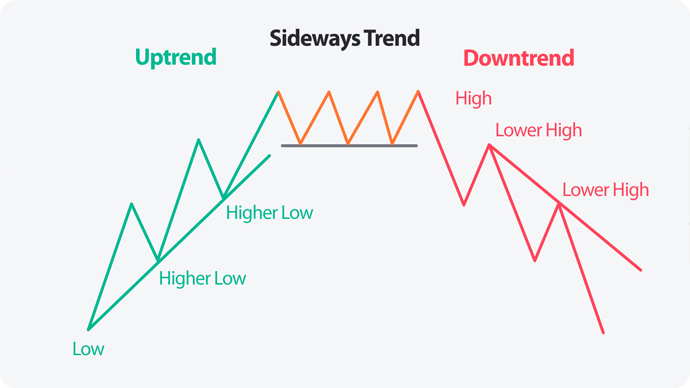
3. Trendlines – Show direction (uptrend/downtrend)
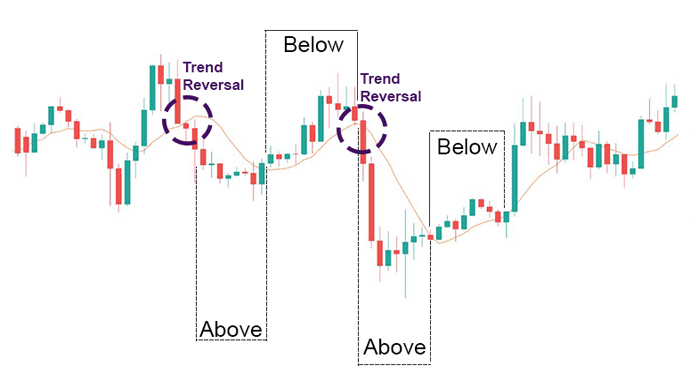
4. Moving Averages (MA) – Smooth out price and spot trends
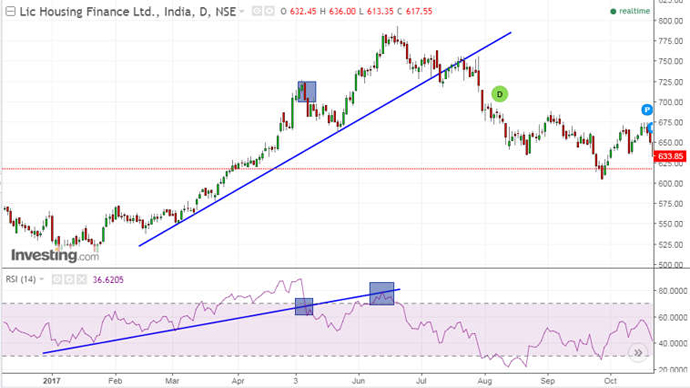
5. RSI – Tells if market is overbought/sold
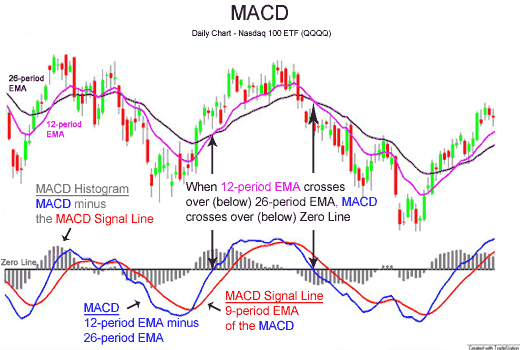
6. MACD – Good for trend and momentum signals
📈 Example Chart: Price + SMA
When price is above the orange SMA line = uptrend
When below = possible downtrend
Easy tool to confirm your trade direction.
💡 Pro Tip
Use technical analysis + risk management = safer trading.
🚀 Start Trading Smart
👉 Open Your Forex Account and trade like a pro with technical analysis.